Financial statements are reports that summarize the operation and performance of an entity over a period. These periods are likely a quarter, half year, and a full year. These statements have USERS like stockholders, potential investors, regulatory bodies, creditors, and those we call internal users like management. These users analyze these statements and use their findings to make decisions.
Analyzing financial statements involves reviewing line items and analyzing them to convey information.
There are several methods of analyzing financial statements; listed below:
1. Horizontal analysis
This involves analyzing financial statements over several accounting periods. Periods like several months or quarters within the same year, and different years. Analyses from left to right.
2.Vertical analysis
Unlike the horizontal analysis, the vertical analysis compares line items within the same period.
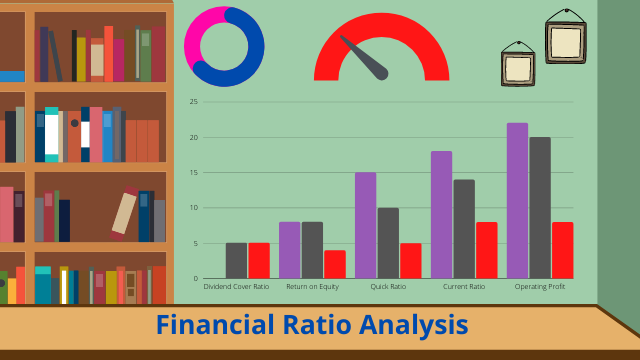
3. Ratio analysis
Ratio analysis is a numerical method used in studying the relationship between various line items in the financial statement.
Our focus here is the latter; Ratio Analysis.
There are several objectives of the ratio analysis. Creditors want to know if the company is capable of paying her debt on time. The stockholder would like to know how the entity is funded; whether equity or debt, or both, and in what proportion. Investors want to see the performance of the entity in the past, to be able to predict future performance. These are a few objectives.
We have 5 ratio analyses, namely: Liquidity ratio, solvency ratio, efficiency ratio, profitability ratio, and market ratio.
Liquidity Ratio.
This ratio indicates a company’s ability to meet its current debt obligation.
Some examples of the liquidity ratio are listed below:
- Current ratio =current assets/current liabilities.
Looks at a company’s ability to meet its current debt obligation when due.
- Acid test =Quick assets (current asset – inventory – prepaid expenses)/current liabilities.
This looks at the company’s immediate current liabilities minus account receivables available to meet obligations.
Solvency ratio
This ratio is used to analyze a company’s long-term debt-paying capability.
- Debt to equity ratio =Total liabilities/Total stockholders equity.
This ratio compares debt funding to equity funding.
- Debt to asset ratio =Total liabilities/Total assets.
This ratio looks at the company’s assets funded by debt.
Profitability ratio
This ratio conveys information on how well the company is sweating the assets to generate earnings.
- Return on sales (Net Margin) =Net income / Net sales.
This looks at the proportion of sales dollars retained as profit.
- Return on investment ( Return on assets) =Net income/average total asset.
This looks at the ratio of wealth generated to the amount invested.
Efficiency ratio
This ratio looks at how well an entity uses its asset and liability.
- Inventory ratio =Net sales/Average inventory.
This looks at how many times inventory is sold and replaced in the year.
- Account Receivable Turnover ratio =Net sales/Average account receivables.
This looks at how many times an entity converts receivables to cash in a year.
Market ratio
This ratio is used to calculate the current share price of an entity.
- Earnings per share =Net earnings available for common stock/Average number of outstanding common stock.
There are many other ratios, and they all have different uses.
It is imperative to note that asides from knowing the formula, an equally necessary part is being able to interpret what these ratios represent, and how to make decisions with them.
#MEMBA11
 Handling Anxiety and Frustration.