In our recent teachings in Data analytics class, we were taught linear regression. Linear regression analysis is used to predict the value of a variable based on the value of another variable. To make it easy, it shows the relationship between two variables. However, after the class one question kept bugging my mind. The question that kept bugging me was how do I apply this in the world of business and why should I. On searching, I was able to simplify it to my understanding.
In all business fields, identifying and studying relationships between variables can provide information on ways to increase profits, methods to decrease costs, or variables to predict demand. In marketing products, many firms use price reductions through coupons and discount pricing to increase sales. This are all relationships that affect each other.
Correlation Analysis?
Correlation is used to test relationships between quantitative variables or categorical variables. In other words, it’s a measure of how things are related. The study of how variables are correlated is called correlation analysis. It is used to measure the strength of the linear relationship between two variables and compute their association
Some examples of data that have a high correlation:
- Your caloric intake and your weight.
- Your eye color and your relatives’ eye colors.
- The amount of time your study and your GPA.
Correlations are useful because if you can find out what relationship variables have, you can make predictions about future behavior. Knowing what the future holds is very important in the social sciences like government and healthcare. Businesses also use these statistics for budgets and business plans.
When we study the relationship between two intervals or variables, we often start with a scatter diagram. This procedure provides a visual representation of the relationship between the variables. The next step is usually to calculate the correlation coefficient. It provides a quantitative measure of the strength of the relationship between two variables.
The Correlation Coefficient
The correlation coefficient describes the strength of the relationship between two sets of interval-scaled or ratio-scaled variables. Designated r, it is often referred to as Pearson’s r. It can assume any value from – 1.00 to + 1.00 inclusive. A correlation coefficient of – 1.00 to + 1.00 indicates perfect correlation.
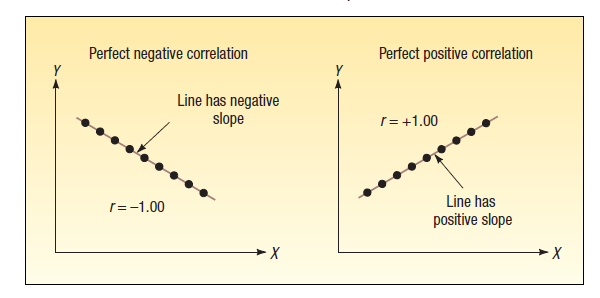
If there is absolutely no relationship between the two sets of variables, r is zero. A correlation coefficient r close to 0 (say, .08) shows that the linear relationship is quite weak. The same conclusion is drawn if coefficients of – 0.91 and +0.91 have equal strength; both indicate very strong correlation between the two variables. Thus, the strength of the correlation does not depend on the direction (either – or + )
 THE POWER OF LOVE