Regression can be broadly described as a statistical method which seeks to determine the nature and strength of the relationship between a “dependent” variable and a series of other “independent” variables. This is a very useful branch of statistics that finds contemporary application in many fields such as finance, investing, anthropology, medicine, agriculture etc. The pioneer of Regression is Sir Francis Galton a Victorian era polymath and cousin of Sir Charles Darwin. He was and accomplished anthropologist, eugenicist, tropical explorer, geographer, inventor, psychometrician and statistician.
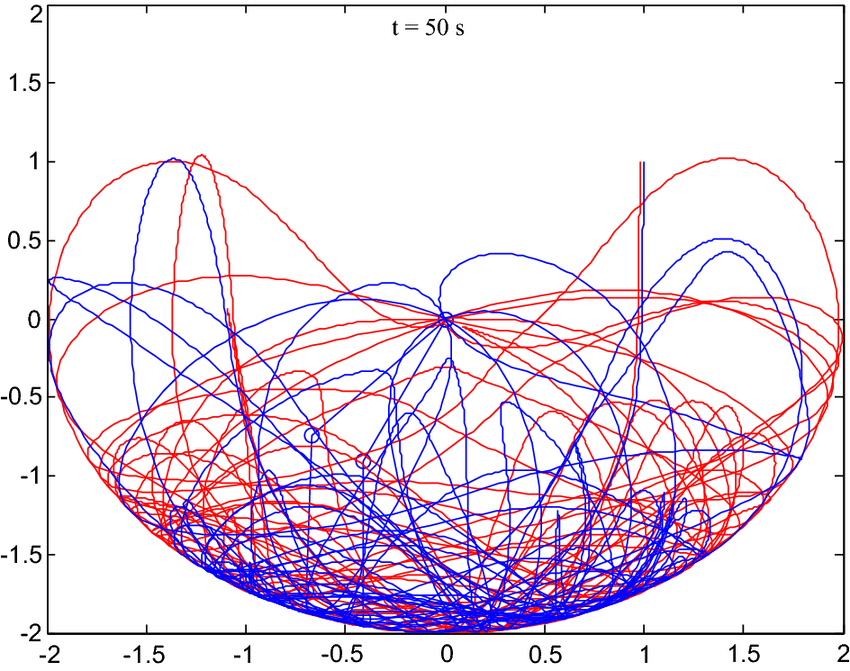
A popular experiment to illustrate regression analysis is the double pendulum which is created by connecting two pendulums together with one attached to the end of the other. This creates a simple physical system that exhibits an extensive dynamic or chaotic behavior. However, this chaotic behavior has a very strong sensitivity to the initial conditions of the experiment. Hence if we know the starting conditions, we can predict with accuracy the chaotic movements that would occur. The Galton board is another useful tool that helps one to visualize chaotic movement. It is impossible to determine the starting condition of the steel balls falling though the pegs, so we cannot predict where any individual ball would land. However, since we have a large number of chaotic events in the system, a pattern would begin to emerge when the experiment is run and from our observations, we can make predictions on where the average steel ball would land, and this is one of the basic ideas and objectives of statistics.
Francis Galton is quoted as saying “Whenever a large sample of chaotic elements are taken in hand and marshaled in the order of their magnitude, an unsuspected and most beautiful form of regularity proves to have been latent all along”. This means the if you have a large number of chaotic events in one system a pattern would emerges so you can make prediction on outcomes of specific variables. That is why when you have a large population of people you can predict what they are going to do because while of their individual choices are random and chaotic, since they are a large system, you can predict what the average person is going to do. this is useful in economics and anthropology.
In business, regression analysis is used to gain insight from data. It is used to determine if and how factors play a role in creating an outcome. It is typically used for sales forecasting, development of products and services and forecasting market trends. It improves the quality of decisions made by business leaders who use it and helps organizations optimize resource deployment.
While regression analysis is very beneficial, in its use, the savvy business leader must be mindful of its limitations. While regression techniques can ascertain relationships, it cannot explain the underlying causal mechanism. When using regression analysis there is a tendency to latch onto simple models which consider few variables which may exclude relevant variables. Also, it focuses on value prediction without considering the prediction interval, if you have a model that is not sufficiently precise, you risk making costly mistakes. With this in mind sensitivities can be built into the forecasting process to mitigate against these limitations.
Ayuba Loko
 Overcoming Linguistics Anxiety