In this piece, I shall endeavor to explain in simple terms, certain things to know about probability and its various applications.
By definition, probability is a numerical measure of the likelihood that an event will occur.
The values are assigned on a scale from 0 to 1. A probability near zero indicates that an event is unlikely to occur, but a probability near the value of 1 indicates that an event is almost certain to occur.
Experiment and Sample space: there is need to briefly talk about these two concepts, as both are actually inter-twined with the concept of probability. Probability plays a major role in determining the outcomes of experiments.
An experiment is any process that generates well-defined outcomes, while a sample space is the set of all experimental outcomes. Consider the illustrations below:
Experiment Sample Space
Toss a coin Head, tail
Inspection of a part Defective, non-defective
Conduct a sales call Purchase, no purchase
Roll a die 1,2,3,4,5,6
Play a football game Win, lose, tie
In the illustrations above, we note that each of the outcomes happens to be the probability of what we are likely to get at various instances.
Assigning probabilities
As stated earlier, the probability assigned to each experimental outcome must be between 0 and 1, inclusively:
0<=P(Ei)<=1
Where: Ei is the ith experimental outcome and P(Ei) is its probability
Also, the sum of the probabilities for all experimental outcomes must be equal to 1.
P(E1) + P(E2) + …. + P(En) = 1
Where:
N is the number of experimental outcomes
We must as a matter of fact note that probabilities can be assigned based on three methods, which are: classical method, relative frequency method, and subjective method.
Classical method: here, probabilities are assigned based on the assumption of equally likely outcomes. If the experiment has n possible outcomes, classical method will assign a probability of 1/n to each outcome. Example is the rolling of a die
Sample space: S = {1,2,3,4,5,6}
Probabilities: Each sample point has a 1/6 chance of occurring.
Relative frequency method: here, probabilities are assigned based on experimentation or historical data.
Example: CBC Rentals
CBC rental would like to assign probabilities to the number of machines it rents each day. Office records show the following frequencies of daily rentals for the last 40 days.
| No of machines rented | Number of days |
| 0 | 4 |
| 1 | 6 |
| 2 | 18 |
| 3 | 10 |
| 4 | 2 |
| No of machines rented | Number of days | Probability |
| 0 | 4 | 0.10 |
| 1 | 6 | 0.15 |
| 2 | 18 | 0.45 |
| 3 | 10 | 0.25 |
| 4 | 2 | 0.05 |
| total | 40 | 1.00 |
We notice from the table that probabilities have been assigned. We note that each probability assigned is given by dividing the frequency (number of days) by the total frequency (total number of days.)
Subjective method: here, we use data based on our experience and intuition, but ultimately a probability value would express our degree of belief
We hereby note that the best probability estimates are obtained by combining the estimates from the classical or relative frequency approach, with the subjective estimate.
In conclusion, we shall briefly talk about events and their probabilities.
An event is a collection of sample points.
The probability of any event is equal to the sum of the probabilities of the sample points in the event. So, if we can identify all the sample points of an experiment and assign a probability to each, we can then compute the probability of the event.
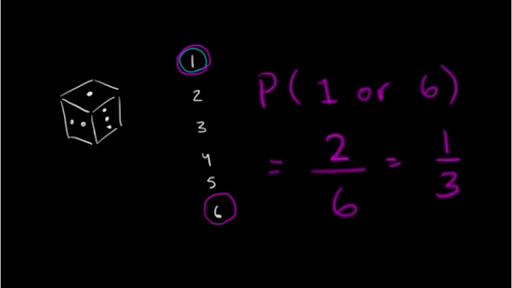
Example: suppose we roll a die, and we want to get an even number while rolling it.
Event E = getting an even number when rolling a die
E = {2,4,6}
P(E) = P(2) + P(4) + P(6)
= 1/6 + 1/6 + 1/6
= 3/6
= 0.5
I do hope this piece is helpful.
Andrew Omeike
#MEMBA 11
 The Deal