This week in Data Analytics, we are going to discuss Probability.
What is a Probability? Probability is a quantitative indicator of how likely something is to happen. The range from 0 to 1 is always used to determine probability values. A probability that is close to zero denotes how unlikely an event is to occur. An event is virtually certainly going to happen if the probability is close to one.
The outcomes of Risks are known, and the probability of such outcomes is also. The outcomes of an Uncertainty are unknown! Risks can be classified as being-

- Systemic- which are events beyond your control.
- Unsystematic- which are events in your control.
- Regulatory- which are events controlled by the government.
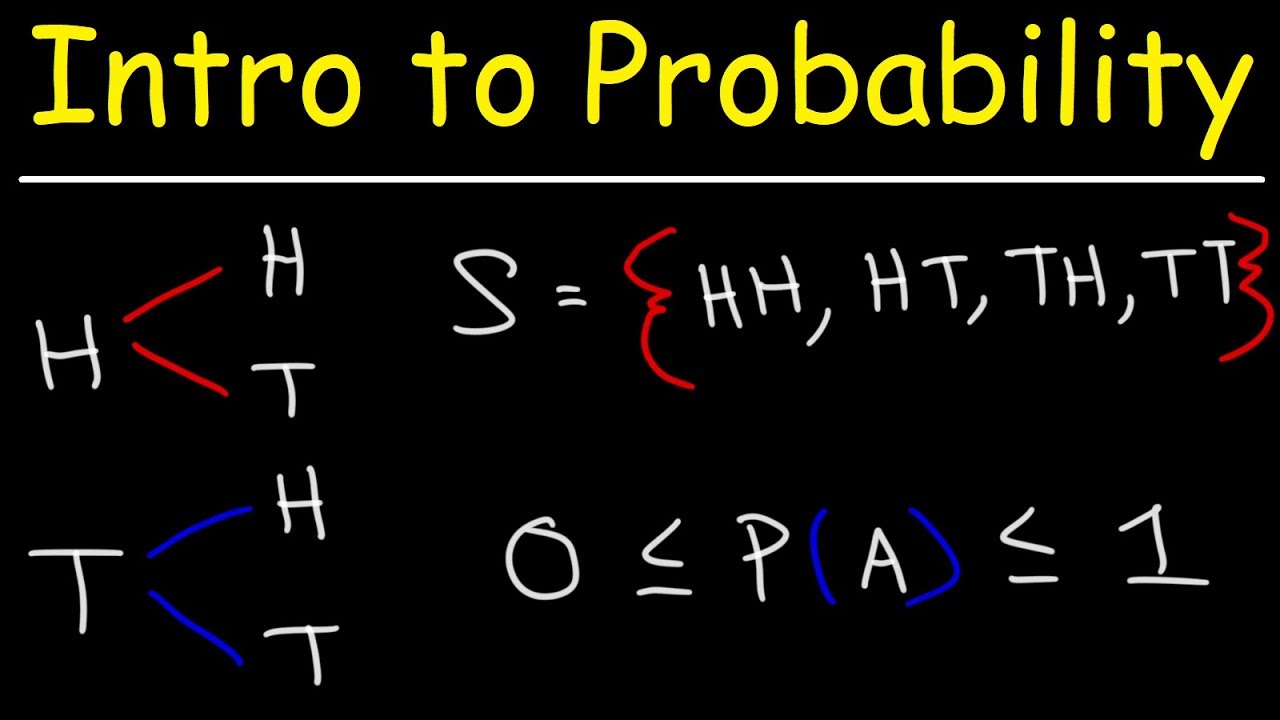
In statistical experiments, probability determines outcomes. Even if the experiment is carried out in the same manner again, a completely different result can still happen. An experiment is any process that generates well-defined outcomes. The collection of all experimental results constitutes the sample space for an experiment. Each sample point must have a probability between 0 and 1. A sample point is another name for the result of an experiment.
Probability in managerial decisions
Probability of my decision to push the company forward. For example, my company must decide how to handle old debts and focus on current suppliers to aid current production and maintain a healthy cash flow. My main aim is to continue production and workflow seamlessly without any hindrances. Will I be needing the services of this supplier in the nearest future? Will putting the old suppliers with debts on a payment plan affect workflow? Will the old suppliers of these raw materials accept the payment plan and cause no further commotion or harm to my company? Etc.
The probability of this decision to push my company forward and continue workflow seamlessly depends on how well I execute my plan.
Assigning a probability
- Classical Method- Assigning probabilities based on the assumption of equally likely outcomes. It considers the pattern of occurrence of a thing to determine the outcome.
- Relative Frequency Method- Assigning probabilities based on experimentation or historical data. It takes into account the number of times an event happens divided by the total number of trials in an actual experiment.
- Subjective method- Assigning probabilities based on personal judgment.
Some of the basic requirements for assigning a probability are:
- The probability assigned to each experimental outcome must be between 0 and 1, inclusively. Thus:
0 < P(Ei) < 1
- The sum of the probabilities for all experimental outcomes must equal 1. Thus:
P(E1) + P(E2) + . . . + P(En) = 1
An event is a collection of sample points. Every event has a probability that is equal to the total of its sample point probabilities. We can calculate the likelihood of an event if we can locate all the sample points in an experiment and give each one a probability. Without having access to all of the sample point probabilities, it is possible to compute the likelihood of an event using some fundamental probability relationships. They include:
- Complement of an Event
- Addition law
- Conditional probability
- Multiplication law
To be continued… #MEMBA11