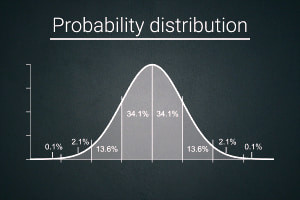
Probability distribution seemed like it was one of the interesting topics in data analytics course , well that was before we entered the numbers and calculations aspects. Probability distribution is knowing how the numbers are spaced out or how they occurred within the data generating process. This is seeing how the numbers are distributed within range. It is the mathematical function that gives the probabilities of occurrence of different possible outcomes for an experiment.
There are 4 types of probability distribution
- Random variables
- Discrete probability distribution
- Binomial probability distribution
- Poisson probability distribution
Random variables: A random variable is a numerical description of the outcome of an experiment. Randomness can take any form. Therefore, a random variable can take any value. Simply put, anything that is defined by outcomes, as long as you think about it, you can say it is a random variable. It may also represent uncertainty, such as measurement error.
Examples are:
- Entering into a competition and not knowing if you will win or lose.
- What is the outcome of advertising jingles, will it increase sales or reduce sales or remain same at status quo.
There are three types of Random variables:
- Discrete random variables
- Continuous random variables
- Mixed random variables
A random variable may assume either a finite number of values or an infinite sequence of values or both.
Discrete random variables: a discreet random variable is one that deals with countable numbers of distinct values, they are usually counted.
The probability distribution of a discrete random variable is a list of probabilities associated with each of its possible values. It is also called the probability function. Example: the number of students in a class, the number of children in a family.
Continuous random variables: a continuous random variable is one which takes an infinite number of possible values. Continuous random variables are most time measurement. It is anything you can measure. For example Let x = the number of television sets sold at the store in a day, where x can take the values of 0, 1, 2, 3, 4, ………, Although we can count the number of customers that come to the store there is no limit to the number that can come in a day.
The major distinction between a discreet random variable and a continuous random variable is that you can count the outcomes of a discreet random variable while what you cannot count is a continuous random variable.
Discrete probability distribution
This is the probability distribution for a random variable that describes how probabilities are distributed over the values of the random variable. It shows the likelihood of occurrence of each possible value of a discrete random variable. We can describe a discrete probability with a table or graph.
Binomial probability distribution
The binomial distribution is a probability distribution that summarizes the likelihood that a value will take one of two independent values under a given set of parameters or assumptions.
The distinct features of the binomial distribution are;
- The experiment consists of a sequence of’ ‘n’ identical trials.
- Two outcomes, success and failure are possible on each trial
- The probability of a success denoted by P, does not change from trial to trial.
- The trials are independent.
This topic is quite intriguing and I will continue on the elaboration in another write up.
 In depth into Financial Statements