Probability distribution refers to the probability law used to express the value of a random variable. The probability of an event expresses the probability of an outcome occurring in an experiment. To fully understand an experiment, you must know all the possible outcomes of the experiment and the probability of each possible outcome, that is, the probability distribution of a random experiment. If the test result is represented by the value of the variable X, the probability distribution of the random test is the probability distribution of the random variable, that is, the possible values of the random variable and the probability of obtaining the corresponding value. Depending on the type of random variable, the probability distribution takes different forms. based on different characters of each distribution type. we get the below summary to make it easier.
- Geometric distribution with below 4 factors:
1) The number of times to do an event is fixed
2) Each event has two possible outcomes
3) The probability of each “success” is equal, and the probability of success is represented by p
4) What you are interested in is, what is the probability of getting the first success if you try this thing x times
2. Bernoulli Distribution is for the trial that only two test results.
3. Binomial Distribution with below 4 factors:
1) The number of times to do something is fixed.
2) Each event has two possible outcomes (success, or failure)
3) The probability of each success is equal
4) What you are interested in is the probability of success x times
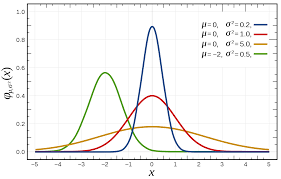
4. The normal distribution is also called the normal distribution, which is a kind of probability distribution of continuous random variables. A large number of phenomena in nature, human society, psychology and education are distributed in a normal form, such as the level of ability, the quality of students’ performance, etc. are all positive. state distribution.Normal Distribution with below 3 factors
1)Centrality: The peak of the normal curve is located in the center, that is, where the mean is located.
2)Symmetry: The normal curve is centered on the uniform number, left and right symmetrical, and the two ends of the curve never intersect the horizontal axis.
3) Uniform variability: The normal curve starts from where the mean is located, and gradually decreases evenly to the left and right sides.
5. Poisson Distribution with below 3 factors
1) Events are independent events
2) In any same time range, the probability of the event happening in the same
3) You want to know what is the probability of something happening x times in a certain time frame
