Does it make sense to continue the joke of learning the correlation. Is there any monetary value to it and does it makes sense at all.
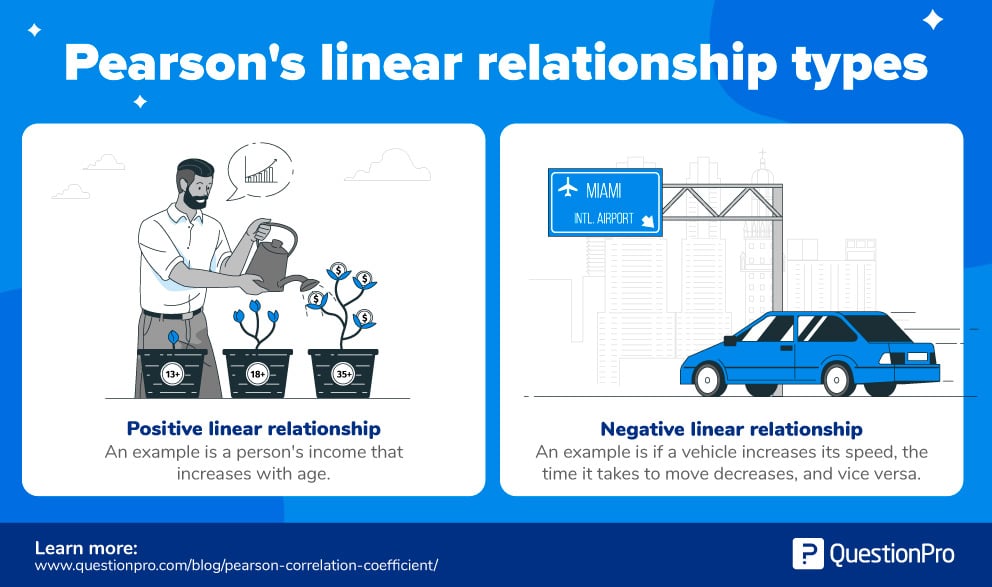
The 3 levels of positive correlations.
Similarly, strongly negative correlations have a more obvious trend than the weaker and lower negative correlation.
The 3 levels of negative correlations
Where does the r value come from? And what values can it take?
The “r value” is a common way to indicate a correlation value. It refers specifically to the (sample) Pearson correlation, or Pearson’s r. The “sample” note is to emphasize that you can only claim the correlation for the data you have, as well as been cautious in making larger claims beyond our data.
The table below summarizes what weve covered about correlations so far.
| PEARSON’S R VALUE | CORRELATION BETWEEN TWO THINGS IS… | EXAMPLE |
| r = -1 | Perfectly negative | Hour of the day and number of hours left in the day |
| r < 0 | Negative | Faster car speeds and lower travel time |
| r = 0 | Independent or uncorrelated | Weight gain and test scores |
| r > 0 | Positive | More food eaten and feeling more full |
| r = 1 | Perfectly positive | Increase in my age and increase in your age |
Ways to Look at the Correlation Coefficient
- Correlation as a function of raw scores and means.
- Correlation as standardized covariance.
- Correlation as a standardized slope of the regression line.
- Correlation as the geometric mean of the two regression slopes
- Correlation as the square root of the ratio of two variances (Proportion of variability of variability accounted for)
- Correlation as the mean Cross product of standardized variables
- Correlation as a function of the angle between the two standardized regression lines.
- Correlation as a function of the angle between the two variables
- Correlation as a rescaled variance of the difference between standardized scores.
- Correlation as the ratio of two means
Correlation Coefficients Pearson, Kendall, and Spearman
Correlation is a Bivariate analysis that measures the strengths of association between two.
variables. In statistics, the value of the correlation coefficient varies between +1 and -1. When
the value of the correlation coefficient lies around ± 1, then it is said to be a perfect degree of
association between the two variables. As the correlation coefficient value goes towards 0, the
relationship between the two variables will be weaker.
There are three types of correlations: Pearson correlation, Kendall rank correlation and Spearman correlation.
Pearson r correlation: Pearson correlation is the most widely used in statistics; it is used to measure the degree of the relationship between linear related variables. For example, in the stock market, if we want to measure how two commodities are related to each other, Pearson correlation is used to measure the degree of relationship between the two commodities.
Spearman rank correlation: Spearman rank correlation is a non-parametric test that is used to measure the degree of association between two variables.
Spearman rank correlation test does not assume any assumptions about the distribution of the data and is the appropriate correlation analysis when the variables are measured on a scale that is at least ordinal.
The following formula is used to calculate the Spearman rank correlation coefficient:
𝜌 = Spearman rank correlation coefficient
di= the difference between the ranks of corresponding values Xi and Yi
n= number of values in each data set.
The Spearman correlation coefficient, 𝜌, can take values from +1 to -1. A 𝜌 of +1 indicates a perfect association of ranks, a 𝜌 of zero indicates no association between ranks and a 𝜌 of -1
indicates a perfect negative association of ranks. The closer 𝜌 to zero, the weaker the
association between the ranks.
#MMBA-4