Depending on the user, financial statement can serve different purposes.
For the internal user (Management), It is used for evaluation, planning etc.
For the external users such as auditors, creditors, stock market advisers, investors, it can be used to determine the financial strength of a company presently, in the past or even prediction based on trends.
Financial statements are published as financial reports in newspapers such as financial times and business day, periodicals like Forbes, and financial information organizations.
For every published financial report, there are things to look out for
- Financial statement
- Notes to financial statement
- Letters to stock holders
- Management discussion and analysis report filled with government and its agents;
There are 5 basic methods of financial statement Analysis
- Horizontal Analysis: this method uses comparative financial statements to calculate percentage change between periods. The statement can be more than one statement.
- Vertical Analysis: for a single financial statement, each item is expressed as a percentage of a significant total. For example, items are expressed as a percentage of the total asset.
- Common sized Analysis: these are used for commercial statement that show only percentage and no absolute dollar amount.
- Trend Percentage: trend percentage analysis can help evaluate financial statement for several years. It shows changes over time in a given financial statement.
- Ratio Analysis: It is an expression of logical relationship between items in a financial statement of a single period. i. e percentage relationship between revenue and net income.
Ratios can be expressed in 3 different ways.
- Ratio e. g 2:1
- % (Profit Margin of 2%)
- $ e. g EPS (earnings per share) of 2.5
Now, there at 10 categories of ratio you must know.
They are,
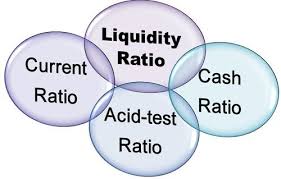
- Current ratio or working capital ratio: this is a ratio of the current asset to current liabilities. This measures the ability of a company to pay debt as they become due.
- Acid Test (Quick) Ratio: this is a ratio of the quick assets to the current liabilities. Quick assets are cash, marketable securities, account receivables (net) and current notes receivables.
- Account receivables Turnover: this is the ratio of the sales on account to average account receivables. This ratio measures how many times a company converts its receivables into cash every year.
- Number of days Sales in account receivables: this is the ratio of the total number of days in a year to the account receivables turn over i.e.
=
365_____
Account receivable turn over
This measures on average how many days it takes to collect an account receivable.
- Inventory turnover: this measures the ratio of cost of goods sold to average inventory. Invariably, it is the number of times a good is sold and replaced in a year.
- Equity or long-term Solvency: This is a measure of the stock holder’s equity to the company’s total asset.
- Net income to Net Sales or Return on sales or profit Margin: This is the ratio of the company’s net income to net sales. It measures the return on sales in percentage.
- Return on average common stock holders’ equity: this is a ratio of net income to average common stock holders’ equity. This measures the income producing ability of a company.
- Earnings per share (EPS): This is the ratio of the earnings available to common stock holders to the weighted average number of common shares outstanding (beginning and end of the year). The financial press publishes the actual and forecasted earnings per share.
- Price earnings Ratio: This is a ratio of the market price per share to the earning per share (EPS).
 The Sad Moments in our Cycling Club.