I would like to tell you about the twins I met in class last week. They looked very identical but behaved and acted differently. I got to know about them during our Data Analysis class, two months into my Executive MBA at the Lagos Business School. Dr. Francis, the course facilitator, called them one of the most fundamental statistical concepts in data analysis. This is because they are crucial to our ability to analyze data and make informed decisions based on the relationships between variables.
The first of the twin was the concept of correlation, which refers to the degree to which two variables are related to each other. A correlation coefficient is used to measure the strength of the relationship between two variables, with values ranging from -1 to 1. A coefficient of -1 indicates a perfect negative correlation, while a coefficient of 1 indicates a perfect positive correlation. A coefficient of 0 indicates no correlation between the variables.
Dr. Francis explained that there are different ways to calculate correlation coefficients, including the Pearson correlation coefficient and the Spearman rank correlation coefficient. We discovered how to read the coefficient and that correlation does not imply causation. This means that just because two variables are correlated, it does not necessarily mean that one caused the other.
Next, we were introduced to the elder twin, regression analysis. This elder twin is used to model the relationship between two or more variables. Regression analysis felt like a significant upgrade since it allows us to predict the value of a dependent variable based on the values of one or more independent variables. We learned how to perform simple linear regression, which involves modeling the relationship between two variables, and multiple linear regression, which involves modeling the relationship between more than two variables.
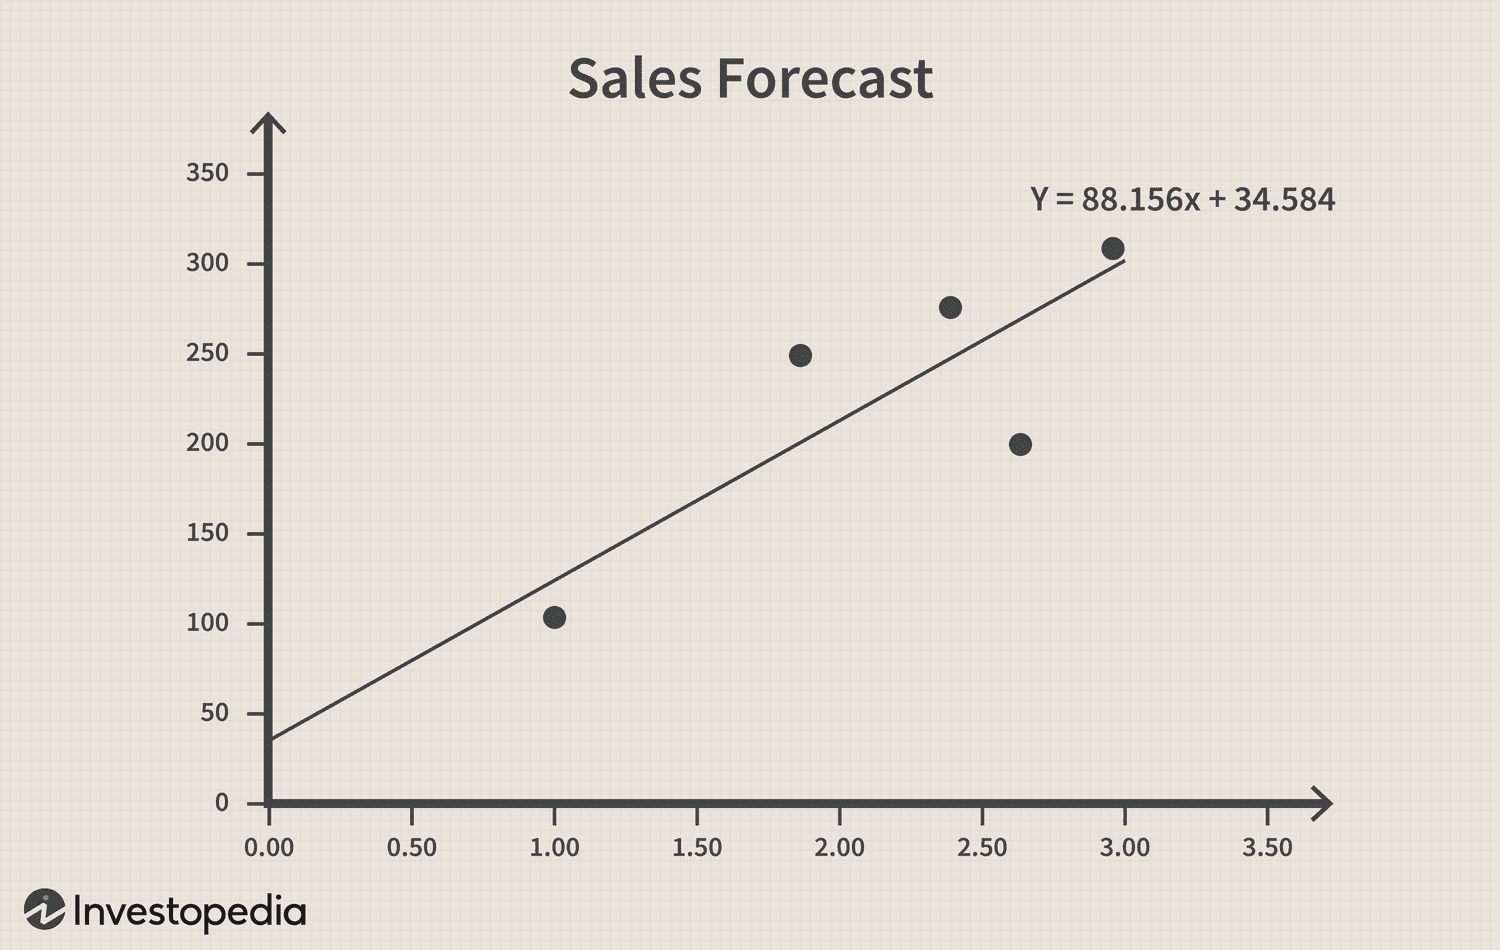
In simple linear regression, we learned how to calculate the slope and intercept of the regression line, as well as the coefficient of determination (R-squared). The slope of the regression line represents the change in the dependent variable for each unit increase in the independent variable. The intercept represents the value of the dependent variable when the independent variable is zero. The coefficient of determination measures how well the regression line fits the data, with values ranging from 0 to 1.
Multiple linear regression involves modeling the relationship between more than two variables. We learned how to interpret the coefficients of the regression equation and how to use the model to make predictions. We also learned about the assumptions underlying regression analysis, such as linearity, independence, normality, and homoscedasticity.
The practical application was the most intriguing aspect of learning about these twins. In one of the exercises, for instance, we analyzed the relationship between the amount spent on advertising and the number of units sold. We used multiple linear regression to model the relationship between these two variables as well as other factors such as the volume of products. We found that advertising was the most significant factor affecting the number of units sold.
Summarily, the experience was quite informative. I gained a better understanding of how to analyze data and make informed decisions based on the relationships between variables. I also learned how to perform regression analysis and make predictions based on the results. These skills are essential for any business leader who wants to make data-driven decisions and stay ahead of the competition.