If you have read my posts long enough, you probably would know by now that I am a lawyer. One of the many commonplace rhetoric about lawyers is our hatred for mathematics and all things statistical. While I am not sure that this is absolutely true, it seems to find some basis in my life on certain occasions.
Early in my LBS journey, I learnt that I would not only face what is one of my greatest nemesis in one course but at least three – Corporate Financial Accounting, Data Analysis and Analysis of Business Problems. This week, I was faced with one of the most daunting topics since I joined LBS – Correlation Analysis.
Correlation analysis is a statistical method used to evaluate the strength and direction of the linear relationship between two often quantitative variables. It helps to determine whether and by how much one variable changes when another variable changes. The result of a correlation analysis is a correlation coefficient, a numerical measure that quantifies the degree of association between the variables.
A brief summary on the key points I learn about correlation analysis:
1. Correlation Coefficient:
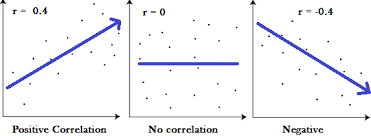
– The correlation coefficient, often denoted by \(r\), ranges from -1 to 1.
– A positive correlation (\(r > 0\)) indicates that as one variable increases, the other tends to increase as well.
– A negative correlation (\(r < 0\)) indicates an inverse relationship such that as one variable increases, the other tends to decrease.
– A correlation coefficient of 0 suggests no linear relationship.
2. Strength of Correlation:
– The closer the correlation coefficient is to -1 or 1, the stronger the correlation.
– An \(r\) value near 0 indicates a weak or no linear relationship.
3. Direction of Correlation:
– The sign of the correlation coefficient indicates the direction of the relationship. What this then means is that a positive correlation tells us that both variable move in the same direction. While a negative correlation indicates that the variables move in opposite directions.
4. Scatter Plots:
– A scatter plot is often used to visually represent the relationship between variables. Points on the plot represent data points, and the pattern they form can provide insights into the correlation.
5. Pearson vs. Spearman Correlation:
– Pearson correlation is suitable for linear relationships and assumes that the data is normally distributed. On the other hand Spearman correlation assesses monotonic relationships (not necessarily linear) and is based on the rank order of values.
6. Causation vs. Correlation:
– One crucial point the faculty tried to hammer upon was that ‘Correlation does not imply Causation’. Even if two variables are correlated, it does not necessarily mean that one variable causes the other to change.
7. Limitations:
– Correlation analysis is sensitive to outliers and may not capture non-linear relationships.
– It only measures the strength and direction of a linear relationship and may not capture complex associations.
To perform correlation analysis, I am grateful for all those that have gone ahead of me and created statistical software like Excel. Using Excel, we do not have to know all the complicated formulas that goes into performing the analysis, we were able to learn the principles behind them and used the software as a tool to enable us save time while gleaming valuable insights from the data available to us. Overall, correlation analysis is a valuable tool for understanding relationships between variables, providing a quantitative measure of their association. However, it is essential to interpret correlation results cautiously and consider other factors before drawing conclusions about causation or making predictions.
#MMBA5


 ABP Learnings: MID-COURSE REVIEW