Regression analysis is a statistical method for examining the relationship between one or more independent variables and a dependent variable. It is a powerful tool that is widely used in a variety of fields such as economics, finance, psychology, marketing, and engineering.
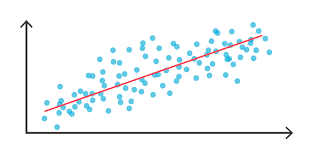
The goal of regression analysis is to find the best-fitting line or curve that represents the relationship between the dependent and independent variables. The dependent variable is the one being predicted or explained, whereas the independent variables are the ones used to make the predictions.
Regression analysis is classified into two types: simple regression and multiple regression. Multiple regression involves multiple independent variables and one dependent variable, whereas simple regression involves one independent variable and one dependent variable.
When there is a clear relationship between two variables and the goal is to quantify that relationship, simple regression analysis is used. Simple regression analysis, for example, can be used in economics to determine the relationship between a company’s sales and its advertising budget. The independent variable is the advertising budget, and the dependent variable is sales.
When there are multiple independent variables that may influence the dependent variable, multiple regression analysis is used. Multiple regression analysis, for example, can be used in marketing to determine the factors that influence a customer’s purchasing decision. The price of the product, the customer’s income, their age, and their gender are examples of independent variables.
There are several steps involved in regression analysis. The first step is to collect data, which entails measuring the dependent and independent variables. The data is then plotted on a graph to show the relationship between the variables. The third step is to choose an appropriate regression model, which can be linear, polynomial, or exponential depending on the nature of the variable relationship.
Once the regression model has been chosen, the parameters of the model must be estimated using a method known as least squares estimation. Finding the line or curve that minimizes the sum of the squared differences between the predicted and actual values is required.
Following the estimation of the parameters, the goodness of fit of the model is evaluated using several statistical measures, such as the coefficient of determination (R-squared) and the standard error of the estimate. R-squared is a metric that measures how well a model fits the data, with values ranging from 0 to 1, with 1 indicating a perfect fit. The standard error of the estimate measures the amount of variation in the data that the model does not explain.
There are several advantages to using regression analysis. To begin with, it provides a quantitative measure of the relationship between variables that can be used to make predictions and inform decision-making. Second, it can determine which variables have the greatest influence on the dependent variable, allowing for targeted interventions or marketing strategies. Finally, it can be used to validate hypotheses and assess the efficacy of interventions or treatments.
However, regression analysis has some drawbacks. For starters, it presumes a linear relationship between the variables, which may not be correct in all cases. Second, it assumes that data errors are normally distributed, which may not be the case in some cases. Finally, it is vulnerable to the multicollinearity problem, which occurs when two or more independent variables are highly correlated, making estimating their individual effects on the dependent variable difficult.
Finally, regression analysis is a powerful tool for examining the relationship between a dependent variable and one or more independent variables. It is widely used in many fields and consists of several steps such as data collection, model selection, parameter estimation, and goodness-of-fit evaluation. While regression analysis has many benefits, it also has some drawbacks that should be considered when interpreting the results. Overall, in today’s data-driven world, it is an essential tool for data analysis and decision-making.

