
Regression Analysis is mainly used to get business insights by comparing the relationship between two or more variables of the market. To make a fully informed business decision you will need to understand how one portion of the business impacts the other variables, leading to an informed decision.
Regression analysis is a statistical method used for the estimation of relationships between 2 or more variables. It is used to assess the strength of the relationship between variables and for creating a model for the future relationship between them.
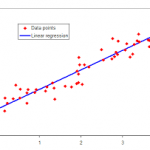
Regression estimates the relationships between a set of independent variables and the dependent variable. It produces a regression equation where the coefficients represent the relationship between independent and dependent variables. You can also use the equation to make predictions.
Researchers often measure independent and dependent variables in studies to test cause-and-effect relationships.
- The independent variable is the cause. Its value is independent of other variables in your study.
- The dependent variable is the effect. Its value depends on changes in the independent variable.
Example: Independent and dependent variables design a study to assess whether changes in room temperature have an effect on math test scores.
Your independent variable is the temperature of the room. You vary the room temperature by making it cooler for half the participants, and warmer for the other half.
Your dependent variable is math test scores. You measure the math skills of all participants using a standardized test and check whether they differ based on room temperature.
This post will explain the capabilities of regression analysis, the types of relationships it can assess, and how it controls the variables. You will learn when you should consider using regression analysis.
Regression analysis can manage many things. For example, you can use regression analysis to;
- Model multiple independent variables
- Include continuous and categorical variables.
- Use polynomial terms to model curvature.
- Assess interaction terms to determine whether the effect of one independent variable depends on the value of another variable.
Regression analysis can decode very intricate problems where the variables are complex. Its analysis describes how the changes in each independent variable are related to changes in the dependent variable. Crucially, regression also statistically controls every variable in your model.
How to Interpret Regression Output
To answer questions using regression analysis, you first need to fit and verify that you have a good model. Then, you look through the regression coefficients and p-values. When you have a low p-value, typically if the p-value is less than 0.05, the independent variable is statistically significant. The coefficients represent the average change in the dependent variable given a one-unit change in the independent variable (IV) while controlling the other IVs.
Regression analysis is a form of inferential statistics. The p-values help determine whether the relationships that you observe in your sample also exist in the larger population.
Obtaining Trustworthy Regression Results
With the vast power of using regression comes great responsibility. Sorry, but that is the way it must be. To obtain regression results that you can trust, you need to do the following:
- Specify the correct model. If you fail to include all the important variables in your model, the results can be biased.
- Check your residual plots. Be sure that your model fits the data adequately. The correlation between the independent variables is called multicollinearity.
Using regression analysis gives you the ability to separate the effects of complicated research questions.


 Use of regression analysis in Data Analytics