
Financial ratios help us to interpret a company’s finances’ raw data to get actionable inputs on its overall performance. The data to compute the ratios can be sourced from a company’s financial statements.
The quantitative interpretation of the company’s financial performance is known as ratio analysis. The analysis gives valuable information pertaining to the organization’s profitability, solvency, operational efficiency and liquidity positions as contained in the financial statements.
The common financial ratios every business should track are the liquidity ratios, the leverage ratios, the efficiency ratio, the profitability ratios and the market value ratios.
These ratios when derived from financial reports of a company are used to establish comparisons either over time or relative to other data in the report. A ratio takes one number and divides it into another number to determine a decimal that can later be converted to a percentage, if desired.
For example, a debt-to-equity ratio looks at the debt liabilities of the company and divides it by the asset equity. If a company has NGN5,000,000 in debt and NGN1,000,000 in equity, the debt-to-equity ratio is two (N5,000,000 / N1,000,000 = 5). This means the company has N1 naira of equity for every N5 of debt. In this case, the larger the ratio over one is interpreted as an increasing debt problem that could lead to long-term financial problems for the company depending on the type of business they do.
To calculate common size ratios from the balance sheet, we simply calculate every asset category as a percentage of the total assets value, and every liability account as a percentage of total liabilities plus owners’ equity values. When the above computation is multiplied by 100 the ratios are converted to percentage values.
The following are some of the Key Financial Ratios:
Every business owner should have a good knowledge of these financial indicators. By understanding what each key financial ratio is assessing, one would be able to derive the ratios easily by looking at the financial statements.
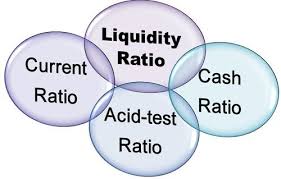
- Liquidity Measurement Ratios: These ratios define if a company is able to meet short-term financial obligations. It takes into consideration liquid assets to short-term liabilities.
- Profitability Indicator Ratios: These ratios consider the amount of profit derived from the cost of goods sold or the operating expenses. There are both gross and net profit margin ratios.
- Debt Ratios: Debt ratios are like the debt-to-equity ratio that considers how much debt a company has and the assets it possesses to pay off those debts.
- Operating Performance Ratios: These ratios look at numbers like the fixed asset turnover or sales-to-revenue per employee numbers to determine efficiency. An efficient company generally improves profitability.
- Cash Flow Indicator Ratios: Companies need to generate enough cash flow to pay operating expenses, grow the business and create a safety net of retained earnings. Operating cash flow divided by sales ratio determines how much it costs to acquire new clients.
- Investment Valuation Ratios: These ratios help investors determine the viability of existing or new investment into a company. For example, the price-to-earnings ratio provides the amount a company is paying per N1 of earnings to shareholders.
Every Company uses ratios to determine the internal trends in the Company and compare growth over a period of time. Business owners can use trends from publicly traded companies that are successful to plan strategically their fiscal cycle.
Interpreting financial statements requires analysis and appraisal of the performance and position of an entity. Analyzing and interpreting financial ratios is logical and one needs to focus on the ratio and not the magnitude of the numbers. For example, when it comes to debt, a company is financially stronger when there is less debt and more assets. Thus a ratio less than one is stronger than a ratio of 5. However, the decision on the level of debt to take is a strategic one and it depends on other factors.
A cash flow margin ratio calculates how well a company can translate sales into actual cash. It is calculated as operating cash flow divided by the net sales. The higher the operating cash flow ratio or percentage, the better.
The same is true with profit margin ratios. If it costs N200 to make a product and it is sold for N400, the gross profit margin is calculated by subtracting the cost of goods sold from revenue and dividing this result by the revenue [(N400- N200) / N400 = 0.5]. The higher this ratio is, the more profit there is per product.
In conclusion, the importance of the analysis and interpretation of financial ratios cannot be over emphasized. Analyzing a company’s financial ratios can provide us with valuable insights into profitability, liquidity, efficiency and more. These ratios can help us visualize how the company has performed over a given period of time.


 The Ife and Modakeke War Part 1