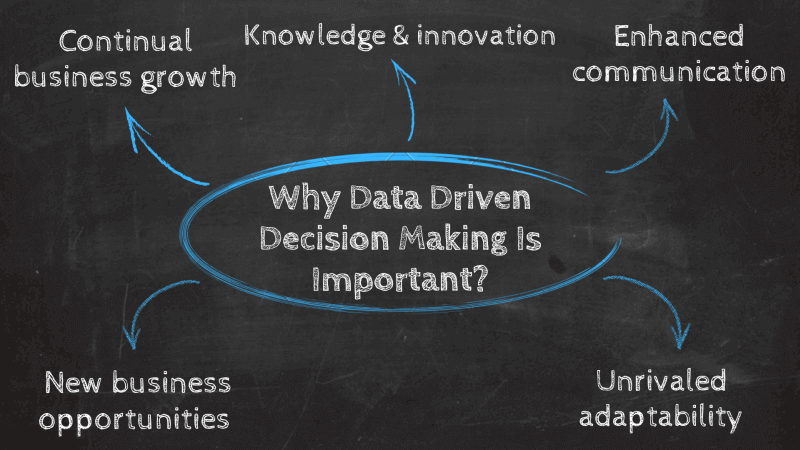
The need for data in our everyday work are necessary for all levels of experiments and research methodologies. We need data to make informed decisions, and the necessity of using data to capture all aspects of our everyday lives makes this a necessity.
The class on data analytics was beginning to make more meaning in my life and clarity brought into the fore and reasons and explanations were given why I should not make decisions based on assumptions but on facts and figures. Because of assumptions, the margin of error is always very high and usually huge. My leaning on assumptions has now been deflected to always request data to establish a fact or before we make both business and personal decisions.
The use of this data will give us a close idea of an action plan to follow or work with. The class session on data analytics is about using probability of an event occurring or not occurring. Hence, with either of the outcomes occurring, the likelihood of impacting any of the likely outcomes and its subsequent outcomes.
The possible outcomes from different events can be determined by the population sample size as a way of linking the individual outcomes and possible result occurring.
The different types of probability and the characteristics of each were highlighted.
Talking about the types of probability distributions, we had discussions on continuous random variables, discrete random variables, binomial probability, and Poisson distribution probability. The meaning of each were highlighted, as well as their functions.
Having to understand them was a bit confusing initially, with examples and live-related examples and stories it became clear on how to distinguish each according to events of activities.
These examples have made learning a bit easier for me on this MBA-Journey. I was taken through what continuous random variables means, having to learn that it is a numerical description of the outcome of an experiment.
We went further to understand the discrete probability distribution, which can be described with a graph, table, or an equation.
Going further we were taught the binomial probability distribution. This is the possibility of two outcomes, success and failure are possible on each trial. In a binomial distribution, the interest is the number of successes occurring in the n trial. The n trial is the total trial carried out.
This can be denoted where x is the number of successes occurring in the n trial. The binomial distribution came with an example and live exercises.
Finally for the day, we treated the last of the series which is on poisson probability distribution and was taught with examples. A poisson probability distributed random variable is often useful in estimating the number of occurrences over a specified interval of time or space. The two properties of a poisson experiment are:
- That the probability of an occurrence is the same for any intervals of equal length.
- That the occurrence or non-occurrence in any interval is independent of the occurrence or non-occurrence in any other interval.
The learning for the day brought some bright feelings to me to continue to learn more and apply the learning in my everyday work as a professional.
#MMBA-4


 What you Need To Know About Analysis of Business Problems.