Every business (PLC) is required by the standard (IFRS) to publish its financial report publicly for the various users of financial statements. These users include shareholders, management, employees, lenders, government agencies such as Federal Inland Revenue Service (FIRS) etc. Each user needs the report for different purposes. For example, shareholders may be interested in dividend or return on Investment, management for decision making, employees for salaries and wages increment, Government for tax etc.
However, there are some categories of users who do not understand figures even when the data are analyzed. Such people require further interpretation or break down to their understanding so as to guide them in making an inform decisions.
Financial statement analysis is a process of reviewing and evaluating a company’s financial statements to gain insight into its financial performance and position. It involves the interpretation of financial data such as income statements, balance sheets, and cash flow statements to identify trends, strengths, weaknesses, and opportunities for improvement.
The reports are crucial for any organization or business, as they provide an overview of the company’s financial performance over a specific period. It is essential to analyse these reports to make informed decisions about the business’s future direction.
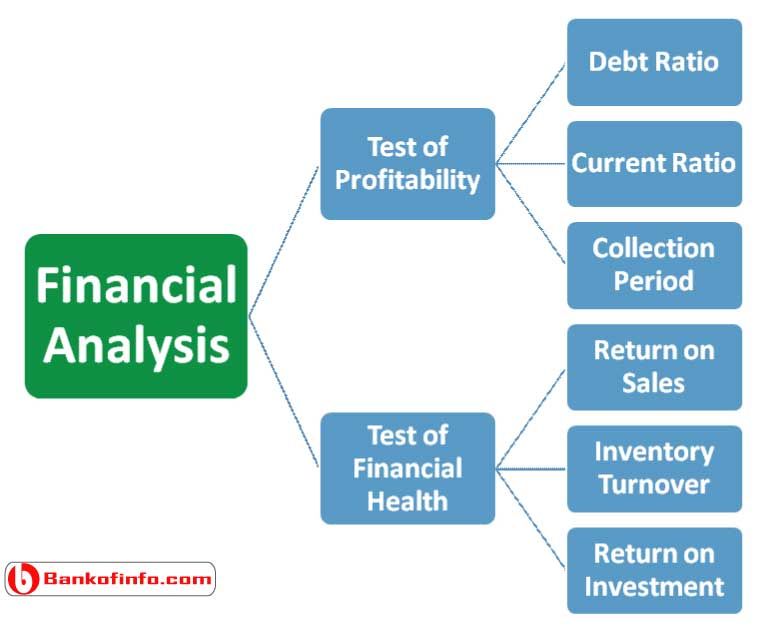
Now, how does these financial data are being analyzed. There are some methods that can be used to analyses financial statement under accounting ratio. These ratios include Profitability ratio, liquidity ratio, solvency ratio and activity ratio and they are explained below:
- Profitability Ratio: this help in analyzing how much profit is earned by a business from its operation for a given period. Under this ratio, there are many sub-ratios that speak to the performance of business. Which helps the users of financial statements to access whether the business is doing well. The ratios include the following:
Return On Capital Employed (ROCE): it helps to understand how well a business is generating profit from its capital as it is put to use. It can be calculated as:
ROCE = Earning Before Interest and Tax (EBIT)/Total Assets – Current Liabilities x 100/1
Gross profit margin: this measures the relationship between revenue and cost of good sold. Revenue is the income generated from good sold. While cost of goods refers to the costs incurred by the business in producing those goods. It can be calculated as:
Gross profit margin = Revenue – cost of good sold/ revenue x 100/1 or
Revenue / cost of sales x 100/1
Profit margin: like gross profit margin, profit margin measures the proportion profit generated by the business to sales (revenue). It implies that the higher the revenue the higher the profit. In other words, it shows the percentage of profit as a result of turnover.
Profit Margin = Net profit/ Sales x 100/1 or EBIT/Revenue x 100/1
- Liquidity ratios: It measure a company’s ability to meet its short-term obligations. One of the most commonly used liquidity ratios is the current ratio, which is calculated by dividing current assets by current liabilities. A ratio of 2:1 is considered ideal, indicating that the company can pay off its short-term obligations with ease. A ratio of less than 1 suggests that the company may have difficulty paying its short-term debts.
To be continue…


 Charts and Excel