Welcome back to the concluding part of my blog post series titled “Profitability Ratio Analysis Made Simple”. You can read series 1.0 here.
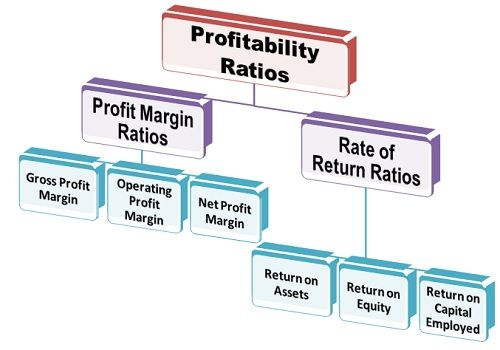
Today, we will turn our attention to learning the return ratios. The return ratios are profitability ratios that examine how effective a business is at using its resources to generate income.
Let us learn the margin ratios using the Lunch & Learn case study:
Exhibit 1: Abridged financial statements of Lunch & Learn Ltd
| Statement of Profit or Loss | 2021 | 2020 | |
| Revenue | 1,311 | 675 | |
| Gross Profit | 511 | 146 | |
| EBIT | 179 | -54 | |
| Net Income | 60 | -85 | |
| Statement of Cashflows | 2021 | 2020 | |
| Operating Cashflow | 219 | 114 | |
| Investing Cashflow | -46 | -25 | |
| Financing Cashflow | 119 | -83 | |
| Statement of Financial Position | 2021 | 2020 | |
| Total Current Assets | 1,026 | 263 | |
| Total Non-Current Asset | 721 | 633 | |
| Total Current Liabilities | 1,309 | 671 | |
| Total Non-Current Liabilities | 256 | 102 | |
| Owners Equity | 183 | 123 |
Return on Assets (ROA) is a return ratio that demonstrates the business’s ability to generate profits using its assets. It measures profitability as it relates to the investments that have been made into the organization’s total assets. It compares net income from the statement of profit or loss to total assets on the statement of financial position.
ROA (%) = Net Income (₦) / Total Assets (₦)
2021: = 60 /1,748
= 3%
2020: =-85 / 896
= -10%
2020 was a very bad year for Lunch & Learn Limited, the return on assets was -10%. This means that the investments of the entity did not provide any benefit to the organisation. However, as the company returned to a positive net income in 2021, the return on assets improved to 3%.
Return on Equity (ROE) is a return ratio that reveals the return that the business has generated for its investors. It compares shareholder’s equity on the balance sheet to net income.
ROE (%) = Net Income (₦) / Total Shareholders’ Equity (₦)
2021: = 60 /183
= 33%
2020: =-85 /123
= -69%
The losses of 2020 eroded up to 69% of the equity capital of Lunch & Learn limited.
Return on Capital Employed measures the profits generated from each long-term capital employed. Unlike return on equity which measures only the company’s common equity, the return on capital employed is a comprehensive approach that measures the overall financial performance of the company, by taking both the equity and the long-term liabilities into consideration.
Return on Capital Employed = EBIT/Capital Employed
Where Capital employed can be calculated in two methods:
- Capital employed = equity + non-current liabilities
- Capital employed = total assets – current liabilities
Return on Capital Employed for Lunch & Learn would be:
2021: = 179 /(256+183)
= 40.82%
2020: =-54/ (102+123)
= -23.99%
The company’s cash return on assets was relatively stable during the period under review. Although 2020 was a slightly better year.
Cash Return on Assets is a return ratio that is used to measure how effective the business is at generating cash with its assets.
Cash Return on Assets (%) = Cash Flow from Operations (₦) / Total Assets (₦)
2021: = 219 /1,748
=12.51%
2020: =114/ 896
=12.76%
The company’s cash return on assets was relatively stable during the period under review. Although 2020 was a slightly better year.
To conclude, companies have come to appreciate the importance of analyzing their profitability ratios. This is because understanding profit trends and comparing them with industry benchmarks can unlock actionable insights and boost corporate performance.
#MMBA11

