For many organizations, making a profit is a primary objective. In economics, profit is the reward an entrepreneur receives for taking a risk. Even not-for-profit organizations require a financial surplus to sustain the impact they set out to achieve. So, we can agree that profit is an important financial success indicator.
How do Accountants Compute Profit?
In for-profit or loss organizations, profit or loss is calculated by subtracting a company’s cost from revenue.
Profit or loss = revenue – cost
In not-for-profit entities, surplus or deficit is calculated by subtracting a company’s expenses from income.
Surplus or deficit = income – expenses
To truly assess an organization’s profitability, calculating profit in absolute terms has some limitations. To uncover hidden insights, managers perform deeper profitability analyses using methods like profitability ratio analysis and break-even analysis.
What Is Profitability Ratio Analysis?
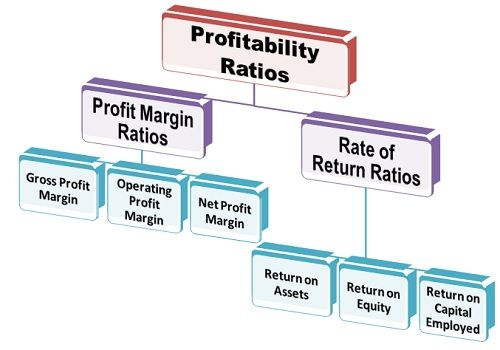
Profitability ratios assess a company’s ability to earn profits from its sales, operations, financial position, cashflows or shareholders’ equity. It indicates how efficiently a company generates returns and value for its owners. The ratios are analysed both individually and comparatively with the broader industry standards. The higher the ratio the better.
Profitability ratios are broadly classified into two:
- Margin ratios: These are concerned with a profit margin at various levels of operations.
- Return ratios: The return ratios focus on how effective the business is at using its resources to generate income.
Let us learn the margin ratios using the Lunch & Learn case study.
Exhibit 1: Abridged financial statements of Lunch & Learn Ltd
| Statement of Profit or Loss | 2021 | 2020 | |
| Revenue | 1,311 | 675 | |
| Gross Profit | 511 | 146 | |
| EBIT | 179 | -54 | |
| Net Income | 60 | -85 |
| Statement of Cashflows | 2021 | 2020 | |
| Operating Cashflow | 219 | 114 | |
| Investing Cashflow | -46 | -25 | |
| Financing Cashflow | 119 | -83 |
| Statement of Financial Position | 2021 | 2020 | |
| Total Assets | 1,748 | 896 | |
| Total Liabilities | 1,565 | 773 | |
| Owners Equity | 183 | 123 |
Gross Profit Margin is a margin ratio that demonstrates the gross profit as a percentage of sales. Both total gross profit and total sales can be located on the statement of profit or loss. The ratio examines how effectively a business is managing its direct cost of services or the cost of goods sold. It is also used to measure the ability of the business to pass its COGS on to its customers.
Gross Profit Margin (%) = Gross Profit (₦) / Sales (₦)
2021: = 511 /1,311
= 39%
2020: =146 / 675
= 22%
This result shows that Lunch & Learn was more profitable in 2021 compared to 2020 because 39% is higher than 22%.
Operating Profit Margin is another margin ratio that is used to understand how efficient a business is at managing its operations. Operating margin is a company’s earnings before interest and taxes (EBIT). It builds on gross profit margin as it layers in the impact of ordinary operating expenses, or overhead.
Operating Profit Margin (%) = EBIT (₦) / Sales (₦)
2021: = 179 /1,311
= 14%
2020: =-54 / 675
= -8%
At the operational performance level, Lunch & Learn incurred 8% losses in 2020. However, the business recovered in 2021 and posted an operating margin of 14%.
Net Profit Margin is the most used margin ratio and is the percentage of net income to sales. This ratio considers net income after accounting for all expenses (such as finance and tax) of the business.
Net Profit Margin (%) = Net Income (₦) / Sales (₦)
2021: = 60 /1,311
= 5%
2020: =-85 / 675
= -13%
Lunch & Learn Limited incurred up to 13% net losses in 2020, which means that the 22% gross profit margin recorded on ₦675 sales was not sufficient to cover all costs. This revelation prompted the company to grow sales and gross profit margin in 2021. The net profit margin for 2021 improved to 5%.
- The Operating cash Flow Margin is the final margin ratio. It illustrates the relationship between cash generated during the normal course of operations and sales. The ratio is used to understand how effective the business is at converting sales to cash. It relies on information from both the statement of profit or loss and the statement of cash flows.
Cash Flow Margin (%) = Cash Flow from Operating Cash Flows (₦) / Sales (₦)
Net Profit Margin (%) = Net Income (₦) / Sales (₦)
2021: = 219 /1,311
= 16.7%
2020: =114 / 675
= 16.9%
Lunch & Learn Limited had a better operating cashflow margin in 2020 despite the lower gross profit margin attained in that year. Its operating cashflow margin slightly declined in 2021, which suggests that the company received less cash from sales.
Enjoy the rest of this article by reading “Profitability Ratios Made Simple: 1.1” which I will publish on the blog tomorrow.
#MMBA11

